Fig. 4

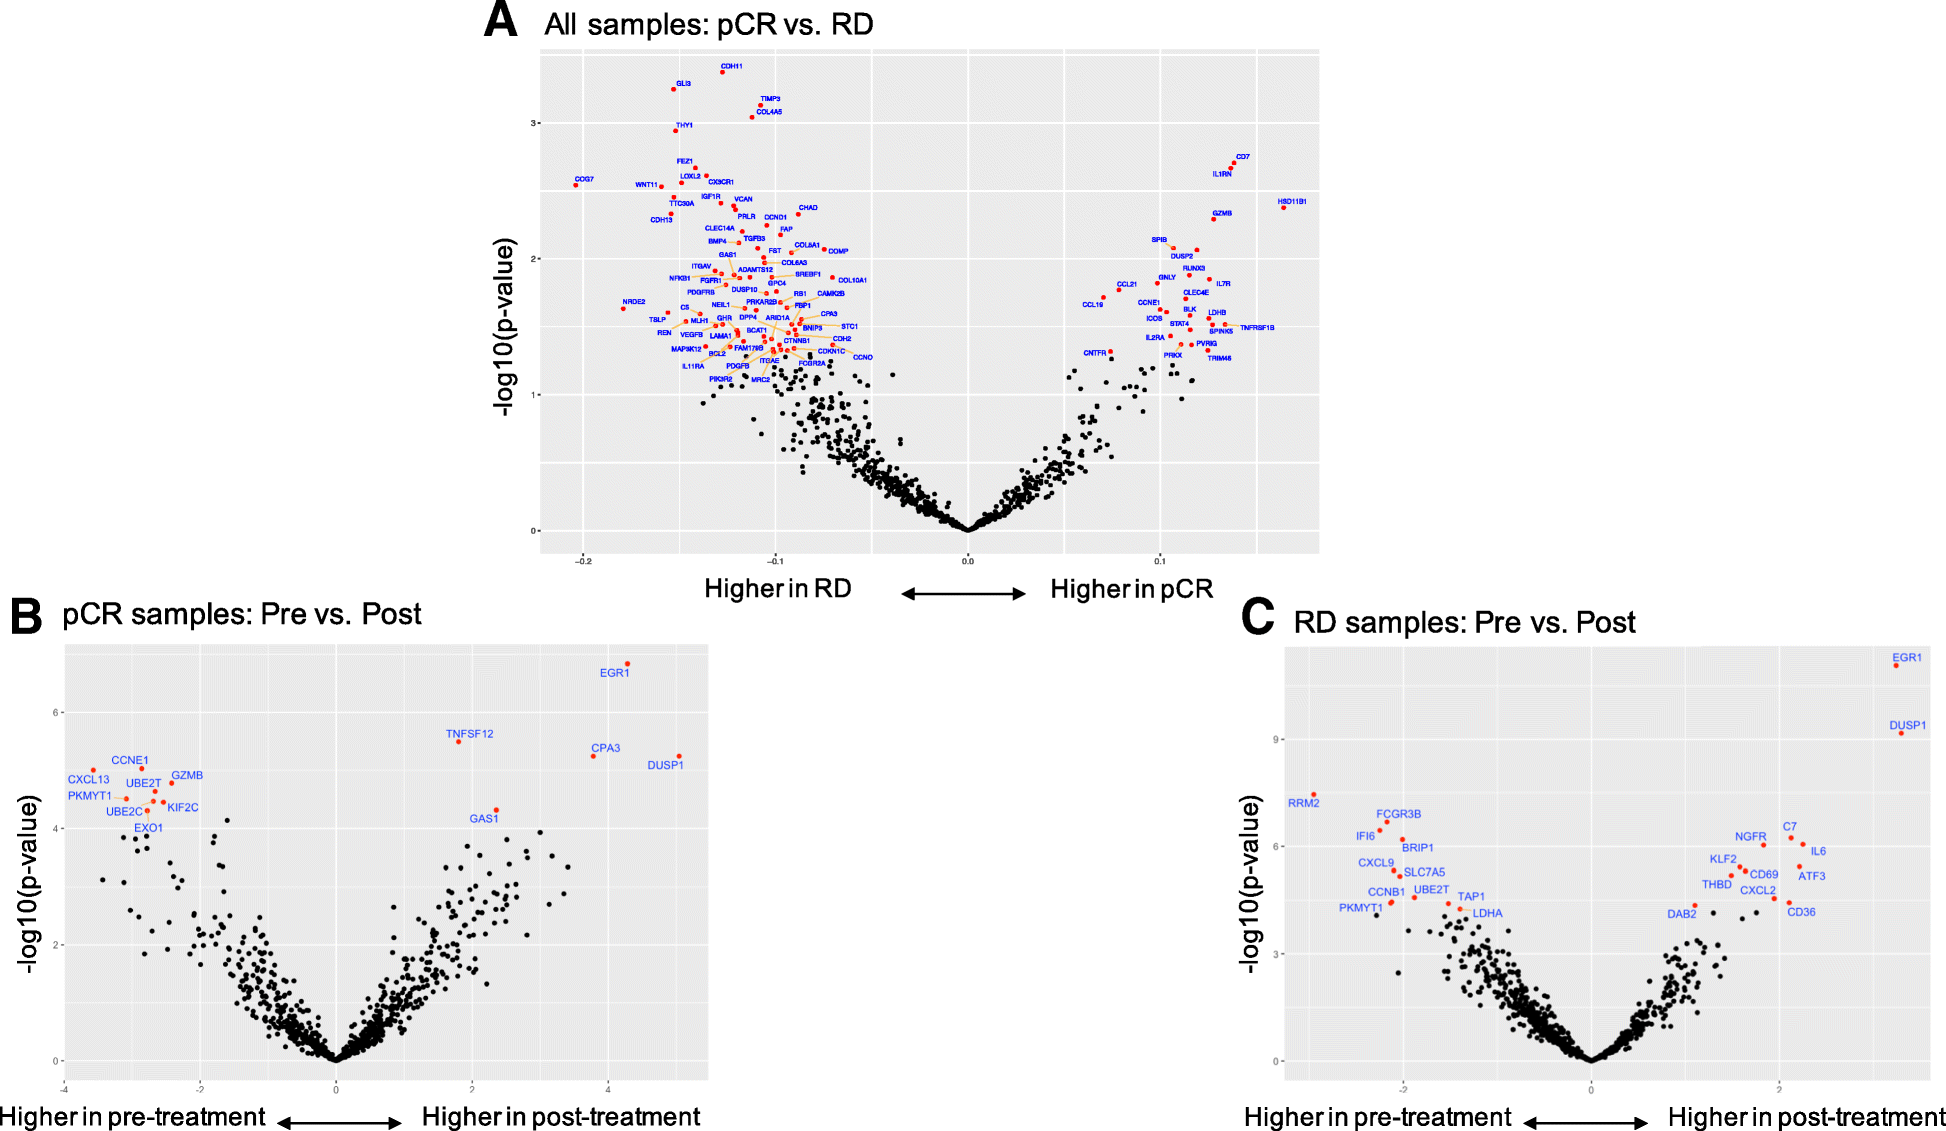
Immune genes associated with response and immune gene expression changes after treatment in cases with pathologic complete response (pCR) and residual disease (RD), respectively. a Volcano plots of the log odds ratio of gene expression by pathologic response status. Each dot represents a gene, the x-axis shows the log2-transformed correlation coefficient for response. Positive values indicate higher expression in the pCR cohort, negative values indicate higher expression in the RD cohort. The y-axis shows -log10-transformed p-values from logistic regression, genes with p < 0.05 are colored red and annotated with names. b Volcano plot of gene expression changes in pre- and post-treatment pCR samples. c Volcano plot of gene expression changes in pre- and post-treatment RD samples. On panels B and C, the x-axis shows the log2-transformed expression difference between pre- and post-treatment tissues; positive values indicate higher expression in post-, and negative values indicate higher expression in pre-treatment samples. The y-axis shows -log10-transformed p-values. Genes that remained significant after Bonferroni adjustment (adjusted p < 0.05) are in red