Fig. 3
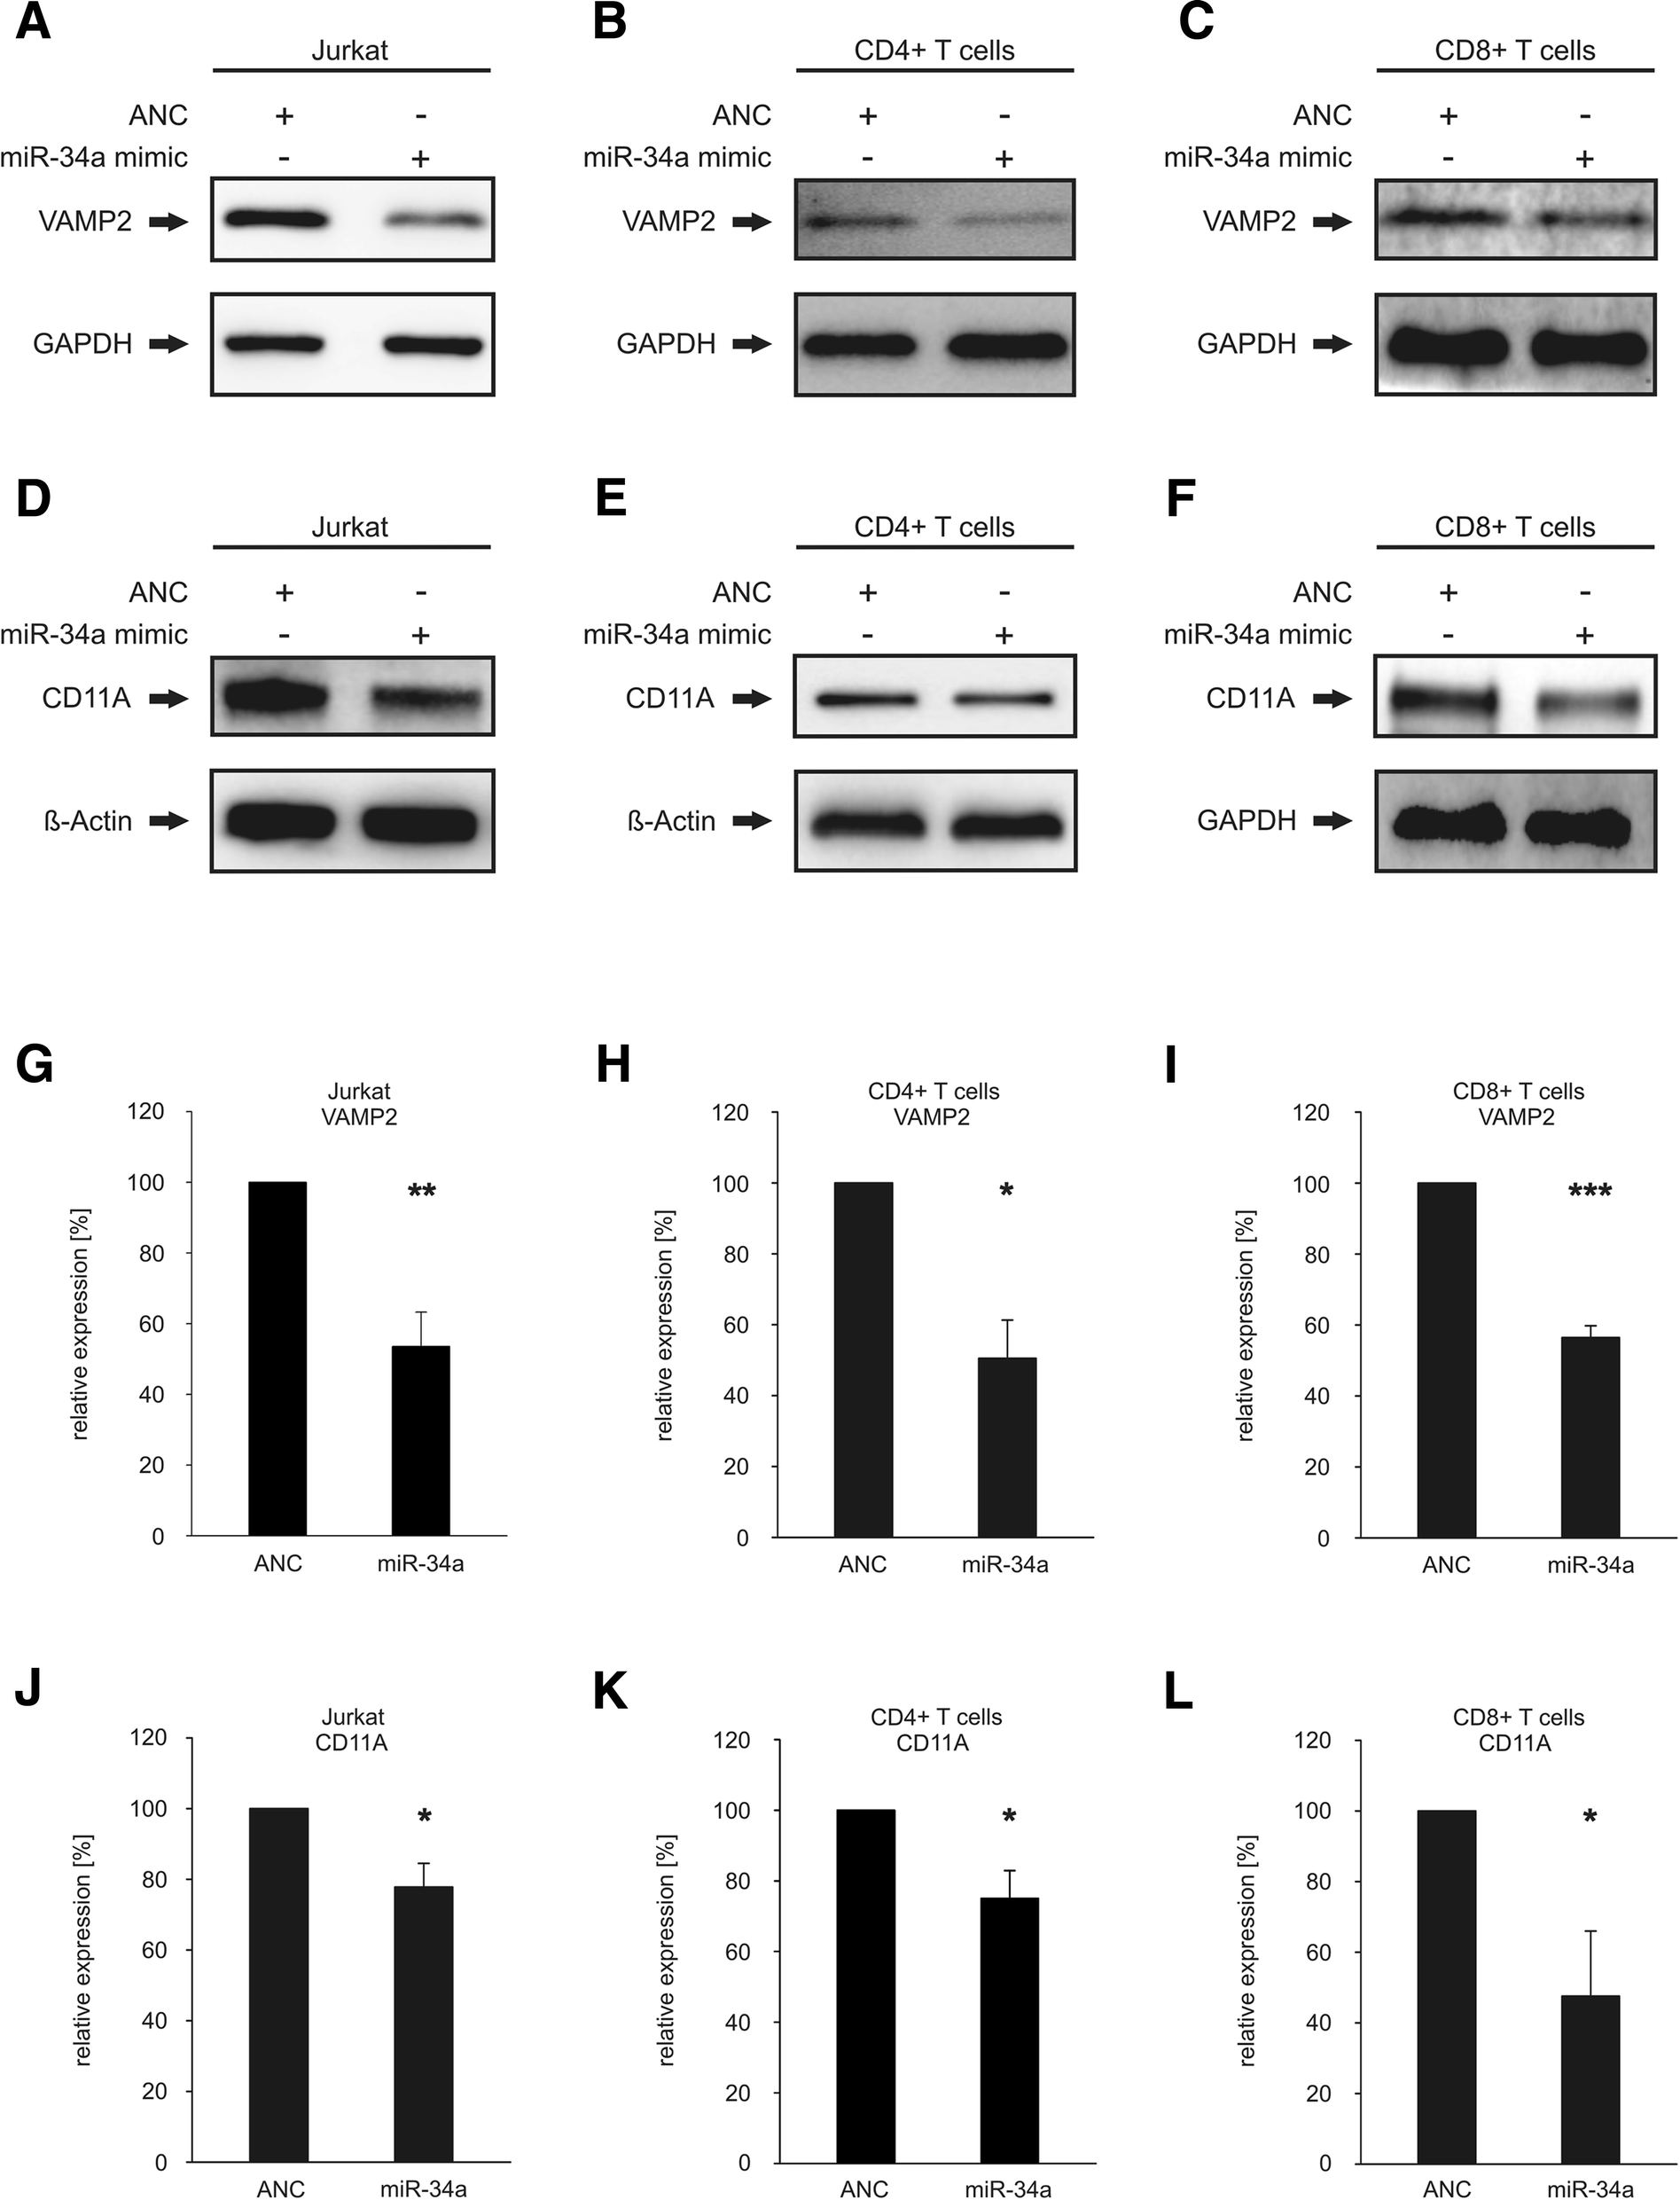
Western blot analysis of VAMP2 and CD11A. a-c Western blot analysis of VAMP2 in miR-34a transfected Jurkat (a), CD4+ (b) and CD8+ T cells (c). The cells were transfected either with allstars negative control (ANC) or miR-34a-5p mimic. 48 h after transfection the endogenous protein level of VAMP2 was analyzed by Western blotting using specific antibodies against VAMP2. GAPDH served as loading control. d-f: Western blot analysis of CD11A in miR-34a transfected Jurkat (d), CD4+ (e) and CD8+ T cells (f). The cells were transfected either with allstars negative control (ANC) or miR-34a-5p mimic. 48 h after transfection the endogenous protein level of CD11A was analyzed by Western blotting using specific antibodies against CD11A. Beta actin served as loading control in Jurkat cells and CD4+ T cells. GAPDH served as loading control in CD8+ T cells. g-i: Quantification of endogenous VAMP2 protein levels in miR-34a transfected Jurkat (g), CD4+ (h) and CD8+ T cells (i). Three independent Western Blots were quantified by densitometry using Image Lab Software. The protein expression of VAMP2 was normalized with respect to the corresponding GAPDH signals of the appropriate samples. One asterisk corresponds to a p-value ≤0.05 and ≥ 0.01, two asterisks to p-value ≤0.01 and ≥ 0.001 and three asterisks to p-value ≤0.001 . j-l: Quantification of endogenous CD11A protein levels in miR-34a transfected Jurkat (j), CD4+ (k) and CD8+ T cells (l). Three independent Western Blots were quantified by densitometry using Image Lab Software. The protein expression of CD11A was normalized with respect to the corresponding beta actin or GAPDH signals of the appropriate samples. One asterisk corresponds to a p-value ≤0.05 and ≥ 0.01